The ride may only be the doorway
Grab coordinates demand, supply, maps and payments across eight countries. That can make each new product cheaper to distribute. The bet is that operating leverage and Financial Services mature before credit losses, competition or dilution absorb the gains. If they do, today's valuation could look remarkably low.
The network
What happens when 53.9 million customers keep using more of the same app?
Q2 monthly users grew 17% while marketplace volume per user also rose 3%. Grab was adding users and making each relationship more valuable at the same time. 1
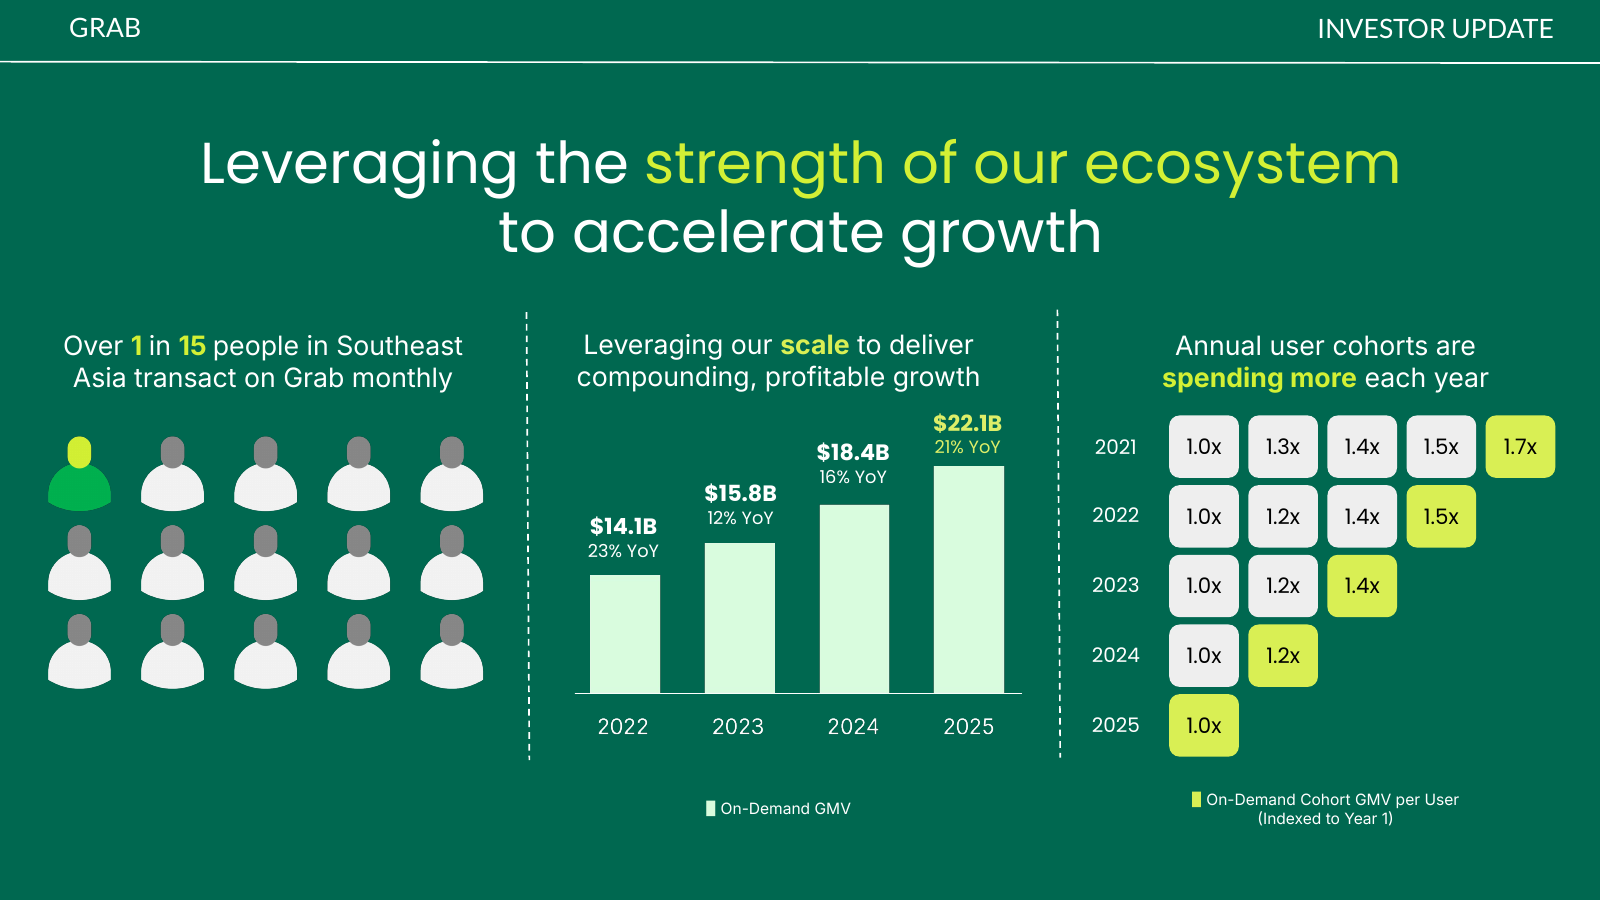
Behavior is the stronger proof. Two of every three monthly users used at least two services in Grab's 2025 data. Subscribers transacted four times more, spent five times more and retained at more than twice the rate of other users. Meanwhile, active drivers grew 19%, delivery merchants grew 8% and mobility transactions grew 28%. More demand attracts supply, better supply improves the experience, and every transaction makes the next service easier to sell. 1 1 2
More users and more daily occasions.
More drivers, restaurants and stores.
Availability, selection and smarter matching.
Ads, loyalty, lending and repeat use.
The regional machine
How hard would this network be to rebuild?
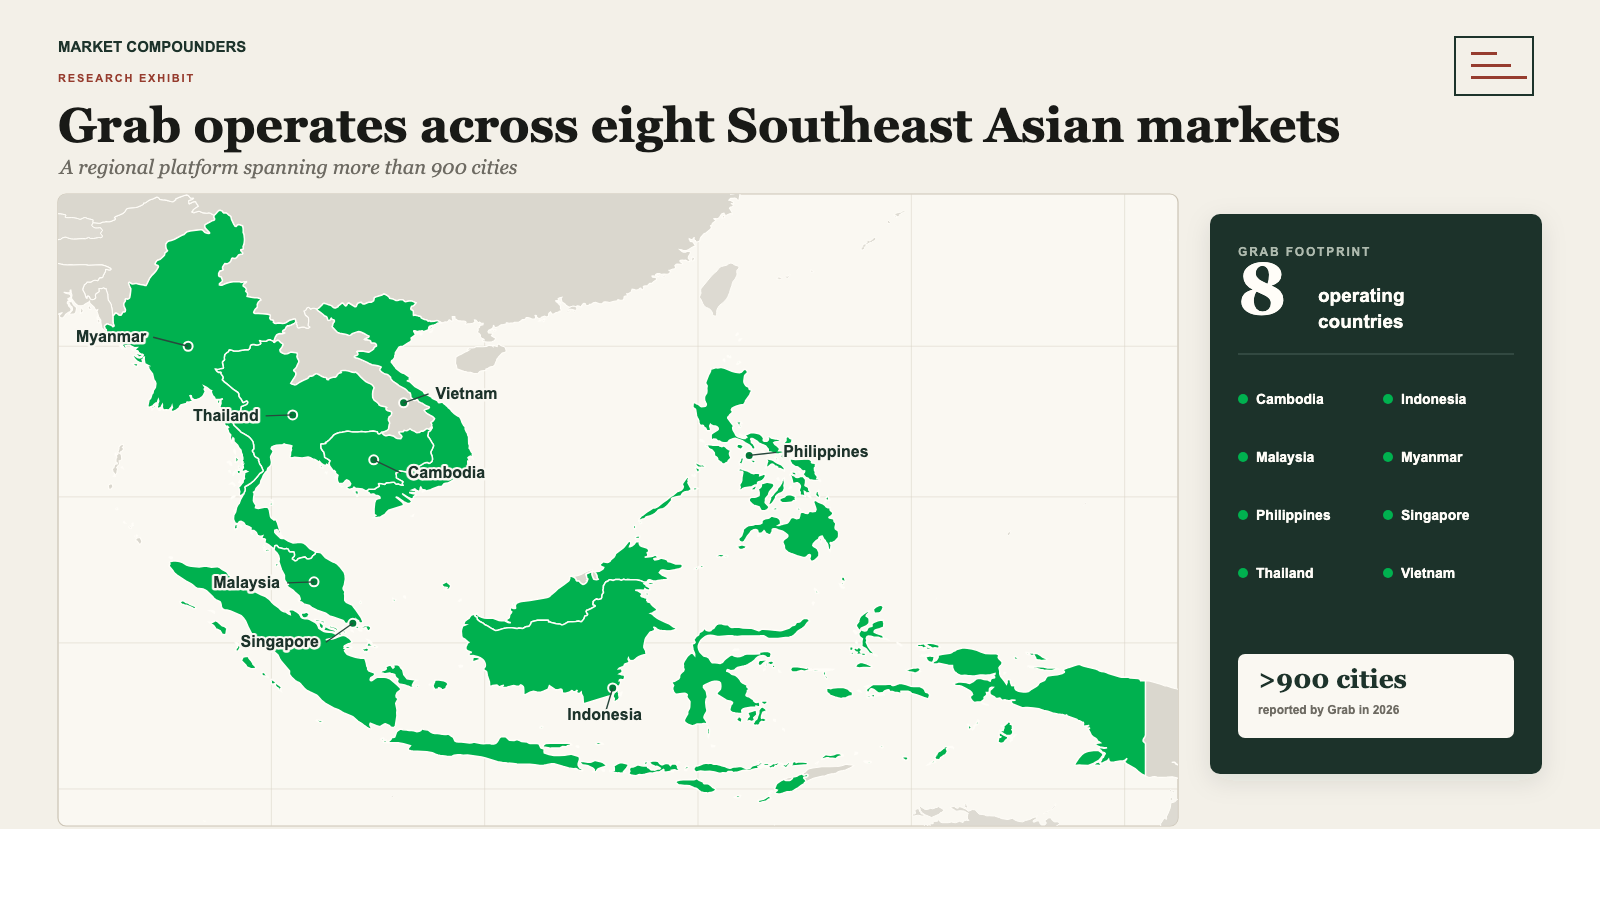
Grab serves more than 900 cities across eight countries, but the city count is not the real advantage. Mobility and delivery share customers, drivers, maps, payments, loyalty and local knowledge. The same driver can carry a passenger in the morning and a meal at lunch. The same restaurant can buy delivery, advertising, payments and credit. Each service gives the next one a warmer start. 1 3
Leadership does not mean the runway is exhausted. It means Grab can expand the category from a position of strength. Cheaper service tiers, more cities, groceries and subscriptions can all raise frequency. From 2021 to 2025, food delivery transactions grew 41%, active merchants rose 25% and the average delivery fee per order fell 8%. Grab made the service more affordable while increasing activity and selection. 2
A huge runway already sits inside the map
About 501 million adults live inside Grab's existing map. The next generation of riders, diners, merchants, savers and borrowers does not require a new continent. 1 11
The comparison uses a population projection and Grab's average monthly user measure. It is a scale illustration, not a market size forecast. 11
A global financial centre with a central bank mandate covering price and financial stability.
Several economies, regulators and demand pools reduce dependence on one local cycle.
Grab is operationally headquartered in Singapore, a real advantage for talent, capital and regional partnerships. Its businesses span eight countries, so one local recession or rule change does not automatically break the whole platform. The protection is not complete. Founders retain voting control, revenue moves with regional currencies and Grab does not disclose a full country revenue split. 3 14
The overlooked runway
What if Grab closes only a small part of the gap with Uber?
Our conservative Q2 calculation shows Uber earning about 3.3 times as much revenue per monthly consumer. Wealthier markets and different definitions explain part of the gap. 1 9
Calculated from company reported Q2 revenue and average monthly users. Grab uses total revenue while Uber excludes Freight, making the comparison deliberately conservative. User definitions and accounting differ. 1 9
The deeper possibility is not that Grab becomes another Uber. It is that Grab earns from more layers of each relationship. Mobility, delivery, membership and advertising already exist. Three digital banks, deposits and lending add a financial layer Uber does not disclose at comparable depth. Rebuilding that position would require licences, partners, underwriting history and years of local trust. 1 9
The profit inflection
What happens when a network this large starts keeping more of every dollar?
Q2 marked an eighteenth straight quarter of adjusted EBITDA growth. The segment figure is before $104 million of regional corporate costs. Group adjusted EBITDA also excludes stock compensation and selected items. 1
Mobility produced $191 million of segment adjusted EBITDA. Deliveries produced $96 million, up 53%, while Financial Services narrowed its loss to $15 million from $26 million. Grab also raised 2026 guidance, with midpoint adjusted EBITDA growth roughly twice as fast as revenue growth. Management's 2028 ambition is $1.5 billion of adjusted EBITDA and 80% conversion into adjusted free cash flow. These are company targets, not guaranteed accounting profits. 1 2
Do not annualize Q2's $235 million accounting profit. It included a $307 million consolidation gain and other favorable items. Operating profit was only $19 million. The bull case depends on recurring cash, not one flattering quarter. 1
A useful precedent
Uber offers a clue, not a blueprint
Uber did not suddenly discover demand in 2023. The network already existed. What changed was how much profit it produced, and the market reacted quickly. 9
2022$1.71bn
2023$4.05bn
up 137%2022loss of $1.83bn
2023$1.11bn
turned positive2022$390m
2023$3.36bn
grew 8.6 times30 Dec 2022$24.73
14 Feb 2024$79.15
rose 3.2 timesGrab is smaller, earlier and exposed to Southeast Asian credit, so this is not a forecast. It is a reminder that the story can be repriced quickly once operating leverage becomes undeniable. 9
The hidden engine
Could Grab become the region's most informed lender?
Southeast Asia is highly digital but still poorly served by formal finance. World Bank data show formal borrowing at only about 8% of adults in Vietnam, 12% in the Philippines and 15% in Indonesia. Grab says its platform has recorded more than 20 billion transactions. Rides, orders, merchant sales, driver earnings, payments and repayments create a view of economic life that a conventional lender rarely sees. 1 3 5
This could make lending unusually productive. Grab can find borrowers inside the app, serve them digitally, price risk using proprietary activity and fund loans through deposits inside regulated banks. We believe lower acquisition costs, better selection and more accurate pricing could support higher returns on lending equity. Grab has not disclosed an audited marginal return, so this remains our thesis. 1 3
Grab should use its information advantage to reject weak loans and grow with seasoned evidence. Chasing fragile borrowers for faster growth could turn the same advantage into large losses.
AI can sharpen the advantage, but discipline decides the outcome
These are management measurements, not audited savings. Grab has not disclosed a lending return created by AI. 1
General models are widely available. Grab's platform history, local maps, purchases, merchant activity, driver income and repayment records are not. Better tools can find patterns, but no model rescues a lender that reaches for weak borrowers.
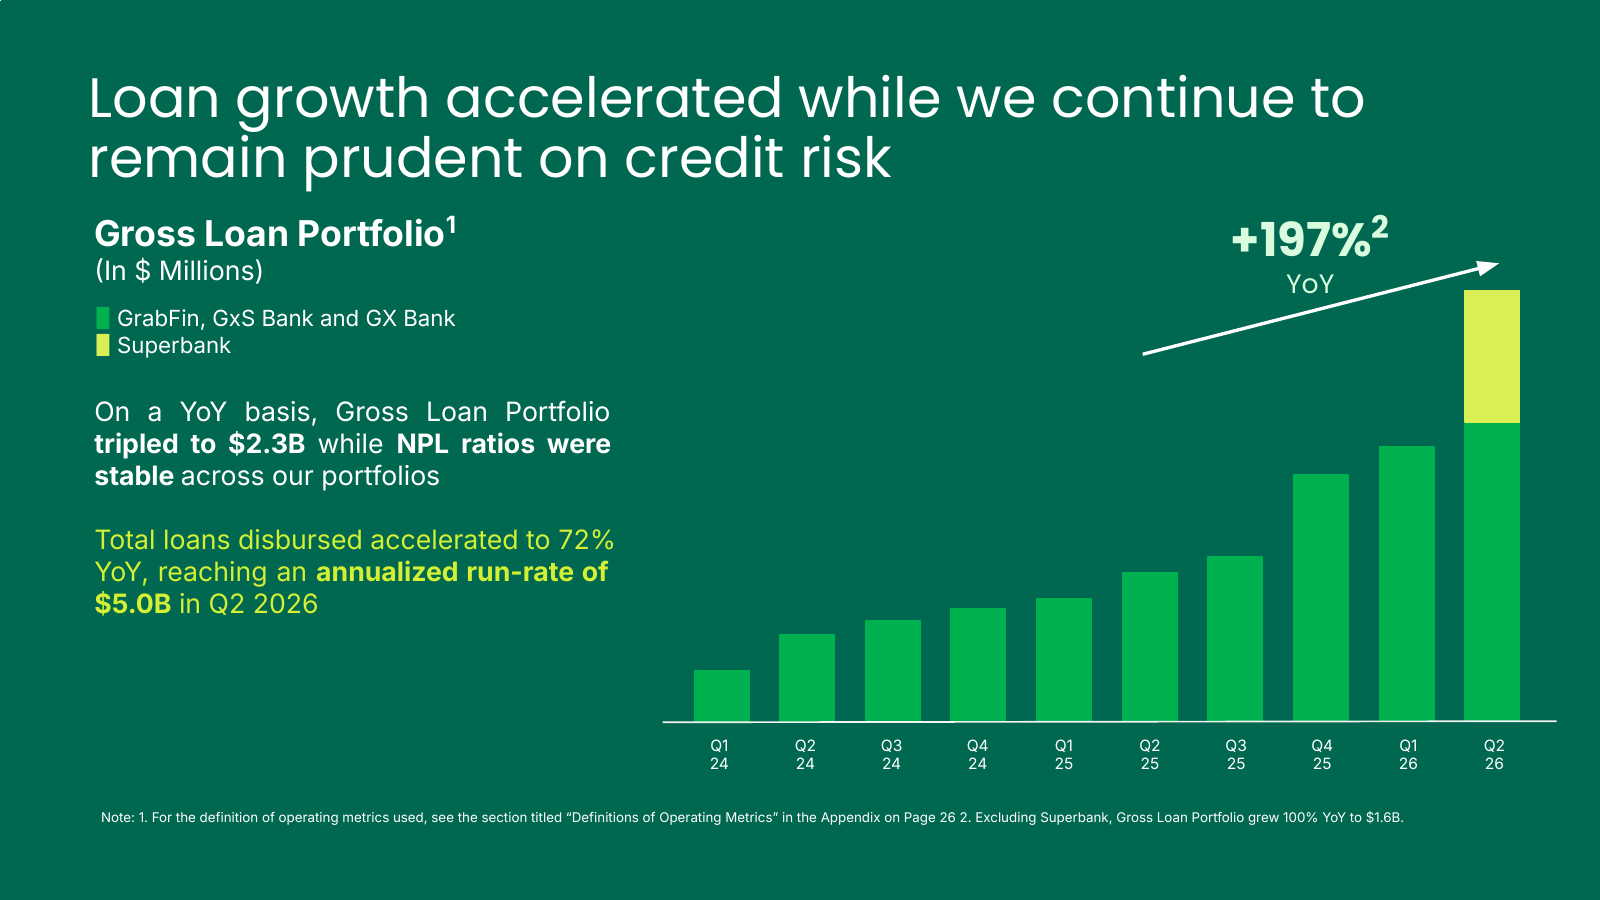
The engine is already moving. Financial Services revenue rose 59% to $134 million, quarterly loan disbursements reached $1.239 billion and the gross loan portfolio nearly tripled. More importantly, each bank begins with customers already connected to Grab. 1 1 2 3
of customer deposits, with about $605 million of customer loans. Grab owns 60%, and 76% of depositors were Grab users.
of customer deposits. It had more than one million transaction customers, and 93% of depositors were Grab users.
customers, with more than 60% also using Grab or OVO. Its gross loan portfolio was $758 million.
of combined customer deposits, alongside a separate $2.318 billion Grab gross loan portfolio.
All balances are shown in U.S. dollars. GXS Bank and GXBank use official exchange rates at their respective reporting dates. Dates and customer definitions differ, so do not add the individual balances. The $2.5 billion figure is Grab's Q2 aggregate. 1 2 3 10
Management expects Financial Services to reach positive adjusted EBITDA in the second half of 2026 and the loan portfolio to exceed $3 billion by year end. If losses remain controlled, this could stop looking like a side business and become one of Grab's largest sources of value.
The price
How much future is hiding inside a $3.70 share price?
At $3.70, Nasdaq valued Grab at $15.17 billion. After a conservative balance sheet bridge and $437 million belonging to outside investors, we estimate the operating enterprise at about $10.6 billion. That equals roughly 2.6 times the midpoint of 2026 revenue guidance and 7.1 times management's $1.5 billion 2028 adjusted EBITDA target. The catch matters: against the midpoint of 2026 guidance, Grab still trades at about 14.5 times adjusted EBITDA. It is not obviously cheap on today's cash flow. It could look dramatically cheap if most of the roadmap becomes durable cash. 1 2 4
The hurdle is clear. Management's 80% conversion target would imply about $1.2 billion of adjusted free cash flow in 2028, or roughly 7.9% of today's equity value before more cash, acquisitions, repurchases or dilution. The latest twelve month figure is still only $450 million. The market wants proof. That is why each strong quarter could matter so much. 1 2 4
Formula: assumed adjusted EBITDA times the company value multiple, plus $5.0 billion of net cash, less $437 million belonging to outside investors, divided by 4.168 billion diluted shares. Each $1 billion change in cash moves value by about $0.24 a share. Using 4.5 billion shares lowers the bull low case to about $7.01. Cash, ownership and dilution will change. These are scenarios, not forecasts. 1 4
The bull scenarios imply roughly 105% to 205% upside from the August 13 close. That possibility comes from several engines working at once: operating leverage, advertising, Financial Services, disciplined acquisitions and buybacks that more than offset stock compensation. None is guaranteed. Together they show why the return could be enormous without relying on a distant price target.
Management and capital
What will management do with the cash?
Grab is funding organic growth, buying capabilities and repurchasing shares. By July it had completed $351 million of 2026 repurchase arrangements, and the board authorized another $750 million. Cumulative authorizations since 2024 reached $1.75 billion. Shares outstanding still declined slightly from December despite stock compensation, an encouraging early sign. 1 3 8
The harder decision is lending. Bank capital should expand only while seasoned loans earn attractive returns after funding, service costs and losses. If that evidence holds, lending could become Grab's best use of retained earnings. If it does not, cash belongs in the core platform, disciplined acquisitions or repurchases.
Capital and optionality
The core is working. The options could make it far more valuable.
Mobility and delivery bring the demand, merchants, drivers, maps and payments. Advertising, loyalty, banking and lending can earn more from that same network. Beyond them sit three possibilities that today's valuation may barely recognize. 1 2
Stash
1m+paying subscribersMore than 1 million paying subscribers and $5.5 billion of assets under management. The adjusted EBITDA positive platform gives Grab subscription and wealth technology with long term strategic value. 6
Autonomous mobility
90,000+autonomous kilometresGrab's Ai.R service had completed more than 90,000 autonomous kilometres by Q2 2026. It is still early, but Grab already owns the demand, maps, routing and local operating layer future fleets would need. We assign it no current earnings value. 7
A possible GoTo combination
91.6%illustrative combined Indonesia ride hailing GMV shareABI Research's first half 2025 estimates put Grab at 50.1% and Gojek at 41.5% of Indonesian ride hailing GMV. The sum is a static illustration, not a forecast. No transaction has been announced. Grab said in June 2025 that the parties were not in discussions then and no definitive agreement existed. Any future combination would depend on acceptable terms and could be prevented or materially reshaped by competition review. 3 13
The uncomfortable questions
What would prove us wrong?
Credit is the central test. The loan portfolio nearly tripled while Q2 impairment losses rose to $72 million from $33 million. Management says delinquency ratios stayed stable, but does not disclose them. Persistent loss growth above loan growth, or lending that consumes cash without producing profit, would weaken the thesis. 1 3
The other danger is paying too much for growth. Incentives rose to 10.9% of marketplace volume from 10.1%. Stock compensation was about $240 million over the latest twelve months, and regulation now spans transport, banking, privacy, investing and autonomous vehicles. Grab also has a $1.5 billion convertible note that can be settled in cash, shares or both. If customers require permanent subsidies, dilution absorbs buybacks or acquisitions scatter management's attention, scale will not translate into value per share. 1 3 6 7 8
Watch what scales faster: value or risk.
We would change our view if Financial Services misses sustainable profitability, credit losses keep outrunning the loan book, incentives rise without stronger retention, the 2028 earnings bridge repeatedly slips, or dilution and acquisitions absorb the gains. 1 2
Our answer
The market sees an app. We see a distribution system.
Grab already owns the scarce assets: regional demand, dense supply, local trust and a growing stream of proprietary data. Mobility and delivery create the habit. Advertising raises the value of each transaction. Banking and lending can deepen the relationship. At an estimated $10.6 billion operating enterprise value, we think the market gives too little credit to how valuable that system could become. 1 2 4
The risks are measurable. Watch credit losses, incentives, cash conversion and value per share. If those remain controlled while operating leverage improves, Grab may not be repriced as a better ride app. It may be recognized as Southeast Asia's financial and data platform hiding in plain sight.
Sources and limits
Source register
Operating and financial data are through June 30, 2026 unless another date is stated. The price is the completed Nasdaq regular market close on August 13, 2026. We prioritized company materials, SEC filings, official public data and clearly labeled independent market estimates. Adjusted EBITDA, adjusted free cash flow and liquidity measures are company defined and may not match other companies. Enterprise value, revenue per user and all share price scenarios are Market Compounders calculations, not company guidance or price targets.
- Grab 2026 results and prepared remarks. Earnings release, Presentation, Prepared remarks, Q1 AI remarks, SEC filing. Official Q2 results and Q1 and Q2 management remarks covering operating metrics, user definitions, AI benefits, credit, guidance and liquidity.
- Grab Three Year Investor Update. Investor update. Official ecosystem engagement, cohort spending, market penetration, product roadmap and company defined 2028 targets.
- Grab company filings and investor facts. 2025 annual filing, Investor facts, Voting results, Transaction update. Official business model, operating countries, Singapore headquarters, Cayman incorporation, credit controls, governance and risk factors.
- Nasdaq GRAB quote. Nasdaq quote. $3.70 regular market close on August 13, 2026. Nasdaq also reported a $15.17 billion market value.
- World Bank Global Findex 2025. Global Findex data. Official 2024 country data on account ownership and formal borrowing, with definitions and methodology.
- Grab acquisition of Stash. Stash announcement. Official transaction structure, paying subscribers, assets under management, profitability claim and 2028 expectation.
- Grab autonomous mobility announcements. WeRide service, May Mobility partnership. Official operating milestones, safety structure and integrations with Grab matching, routing, mapping and fleet tools.
- Grab capital actions. Convertible notes, Share repurchases, foodpanda Taiwan. Official terms for the convertible notes, repurchase program and proposed foodpanda Taiwan acquisition.
- Uber filings, profitability and share price record. Q2 2026 filing, 2025 annual filing, 2022 results, 2023 results, 2023 proxy, February 2024 price. Official current operating data, 2022 and 2023 results, official 2022 closing price and secondary February 2024 price used for the historical analogy.
- Digital bank balances and currency translations. GXS statements, Singapore exchange rate, Customer update, Financial statements, Malaysia exchange rate. Official GXS Bank and GXBank updates, financial statements and period end exchange rates used for the displayed dollar estimates.
- United Nations World Population Prospects 2024. Population workbook. Official age group workbook used for the 2026 medium projection of people age 18 and above across Grab's eight countries.
- DBS regional market estimates. DBS regional estimates. DBS research presenting Grab at about 70% regional mobility share and 55% regional delivery share in June 2024.
- ABI Research Indonesia mobility estimate. ABI Indonesia estimate. Independent 2025 Indonesia mobility estimate from ABI Research.
- Singapore institutional framework. Central bank law, Finance Ministry overview. Official central bank objectives, currency framework, reserve management and sovereign rating information.
Research disclosure
This is general research and editorial opinion, not personalized investment advice or an offer to buy or sell a security. Investing can result in loss of principal. Position disclosure: the author's current GRAB position was not provided for this draft. Readers should assume the author may own GRAB or related securities and could benefit if the price rises.