The whole bet in one paragraph
Can a bank this cheap really compound? We think so. Brazil, currency, and young credit cohorts deserve a discount. But Inter does not need Nu’s scale or flawless execution. It needs current earnings to remain broadly durable while customer value, credit discipline, and return on equity improve. At roughly 7.1× annualized Q2 earnings per share, we think the market has overcharged for visible, measurable risks. 1 2 3 8 9
The awkward question
How did Inter grow this fast with Selic (central bank rate) above 14%?
Selic stayed above 14% throughout Q2. Brazil’s central bank cut it to 14.00% at its August 5 meeting, effective August 6. In that punishing setting, Inter’s expanded loan portfolio grew 29%, net revenue 31.7%, and profit attributable to shareholders 33.6%. Expenses rose about 19%, while return on equity improved 2.4 percentage points to 16.3%. A business taking share before the environment gets easier deserves attention. 1 2 6 12
Was it reckless lending? Brazilian financial system credit grew 9.7% year over year in June, versus 29% for Inter’s expanded portfolio. Inter includes R$3.5 billion of private securities, but the gap remains striking. Its Q2 deck also reports gains across seven products. This looks like a digital bank prying customer relationships away from entrenched incumbents. 1 2 13
Does the thesis need rapid cuts? No. Easier money could help, but Q2 showed Inter can advance while Brazil is difficult. The first cut is a possible tailwind, not a rescue plan.
How does it finance the growth? Company-defined funding reached R$77.2 billion, up 24%. Inter also reported 9 million investment clients and R$10.3 billion in My Piggy Bank from more than 4 million clients. Its company-defined cost of funding was only 65.9% of CDI, Brazil’s interbank benchmark rate. 1 2
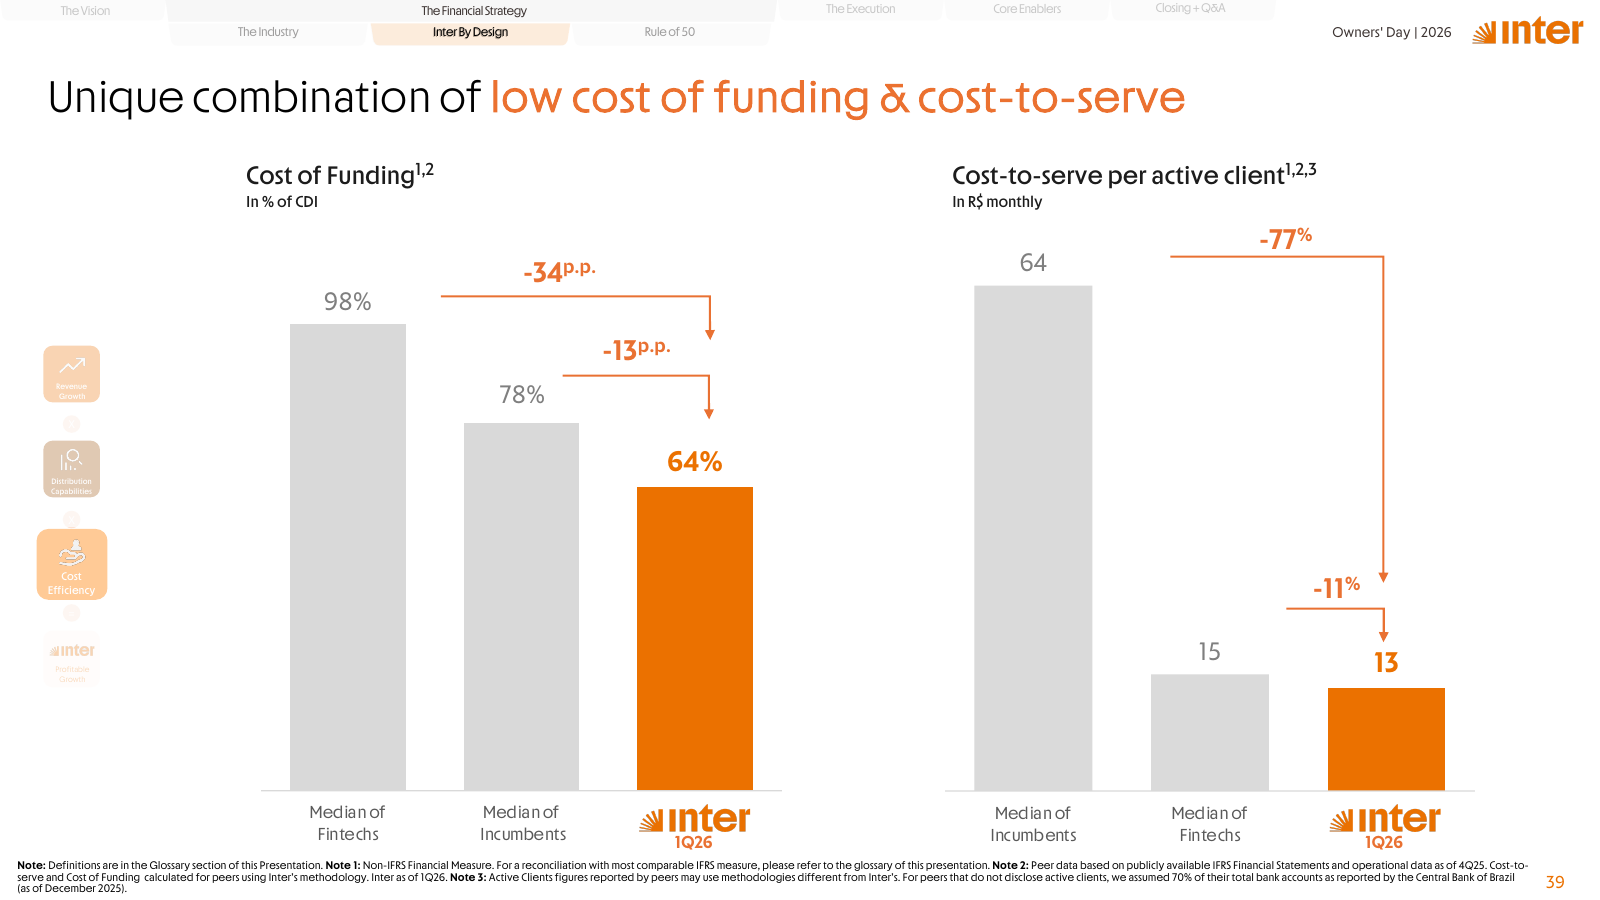
Inter’s comparison put its 1Q26 cost at 64% of CDI, versus 78% for the median incumbent and 98% for the median fintech, recalculated from 4Q25 peer data. The names are undisclosed and the work is company-built. Even so, cheaper money can support competitive pricing, healthier spreads, and lending capacity when Selic is high. 4
Inter grew revenue and profit above 30% before Brazil became friendly. A less hostile macro could meet a business already carrying momentum.
The hidden asset
What if the app already has the customers, but not yet their full economics?
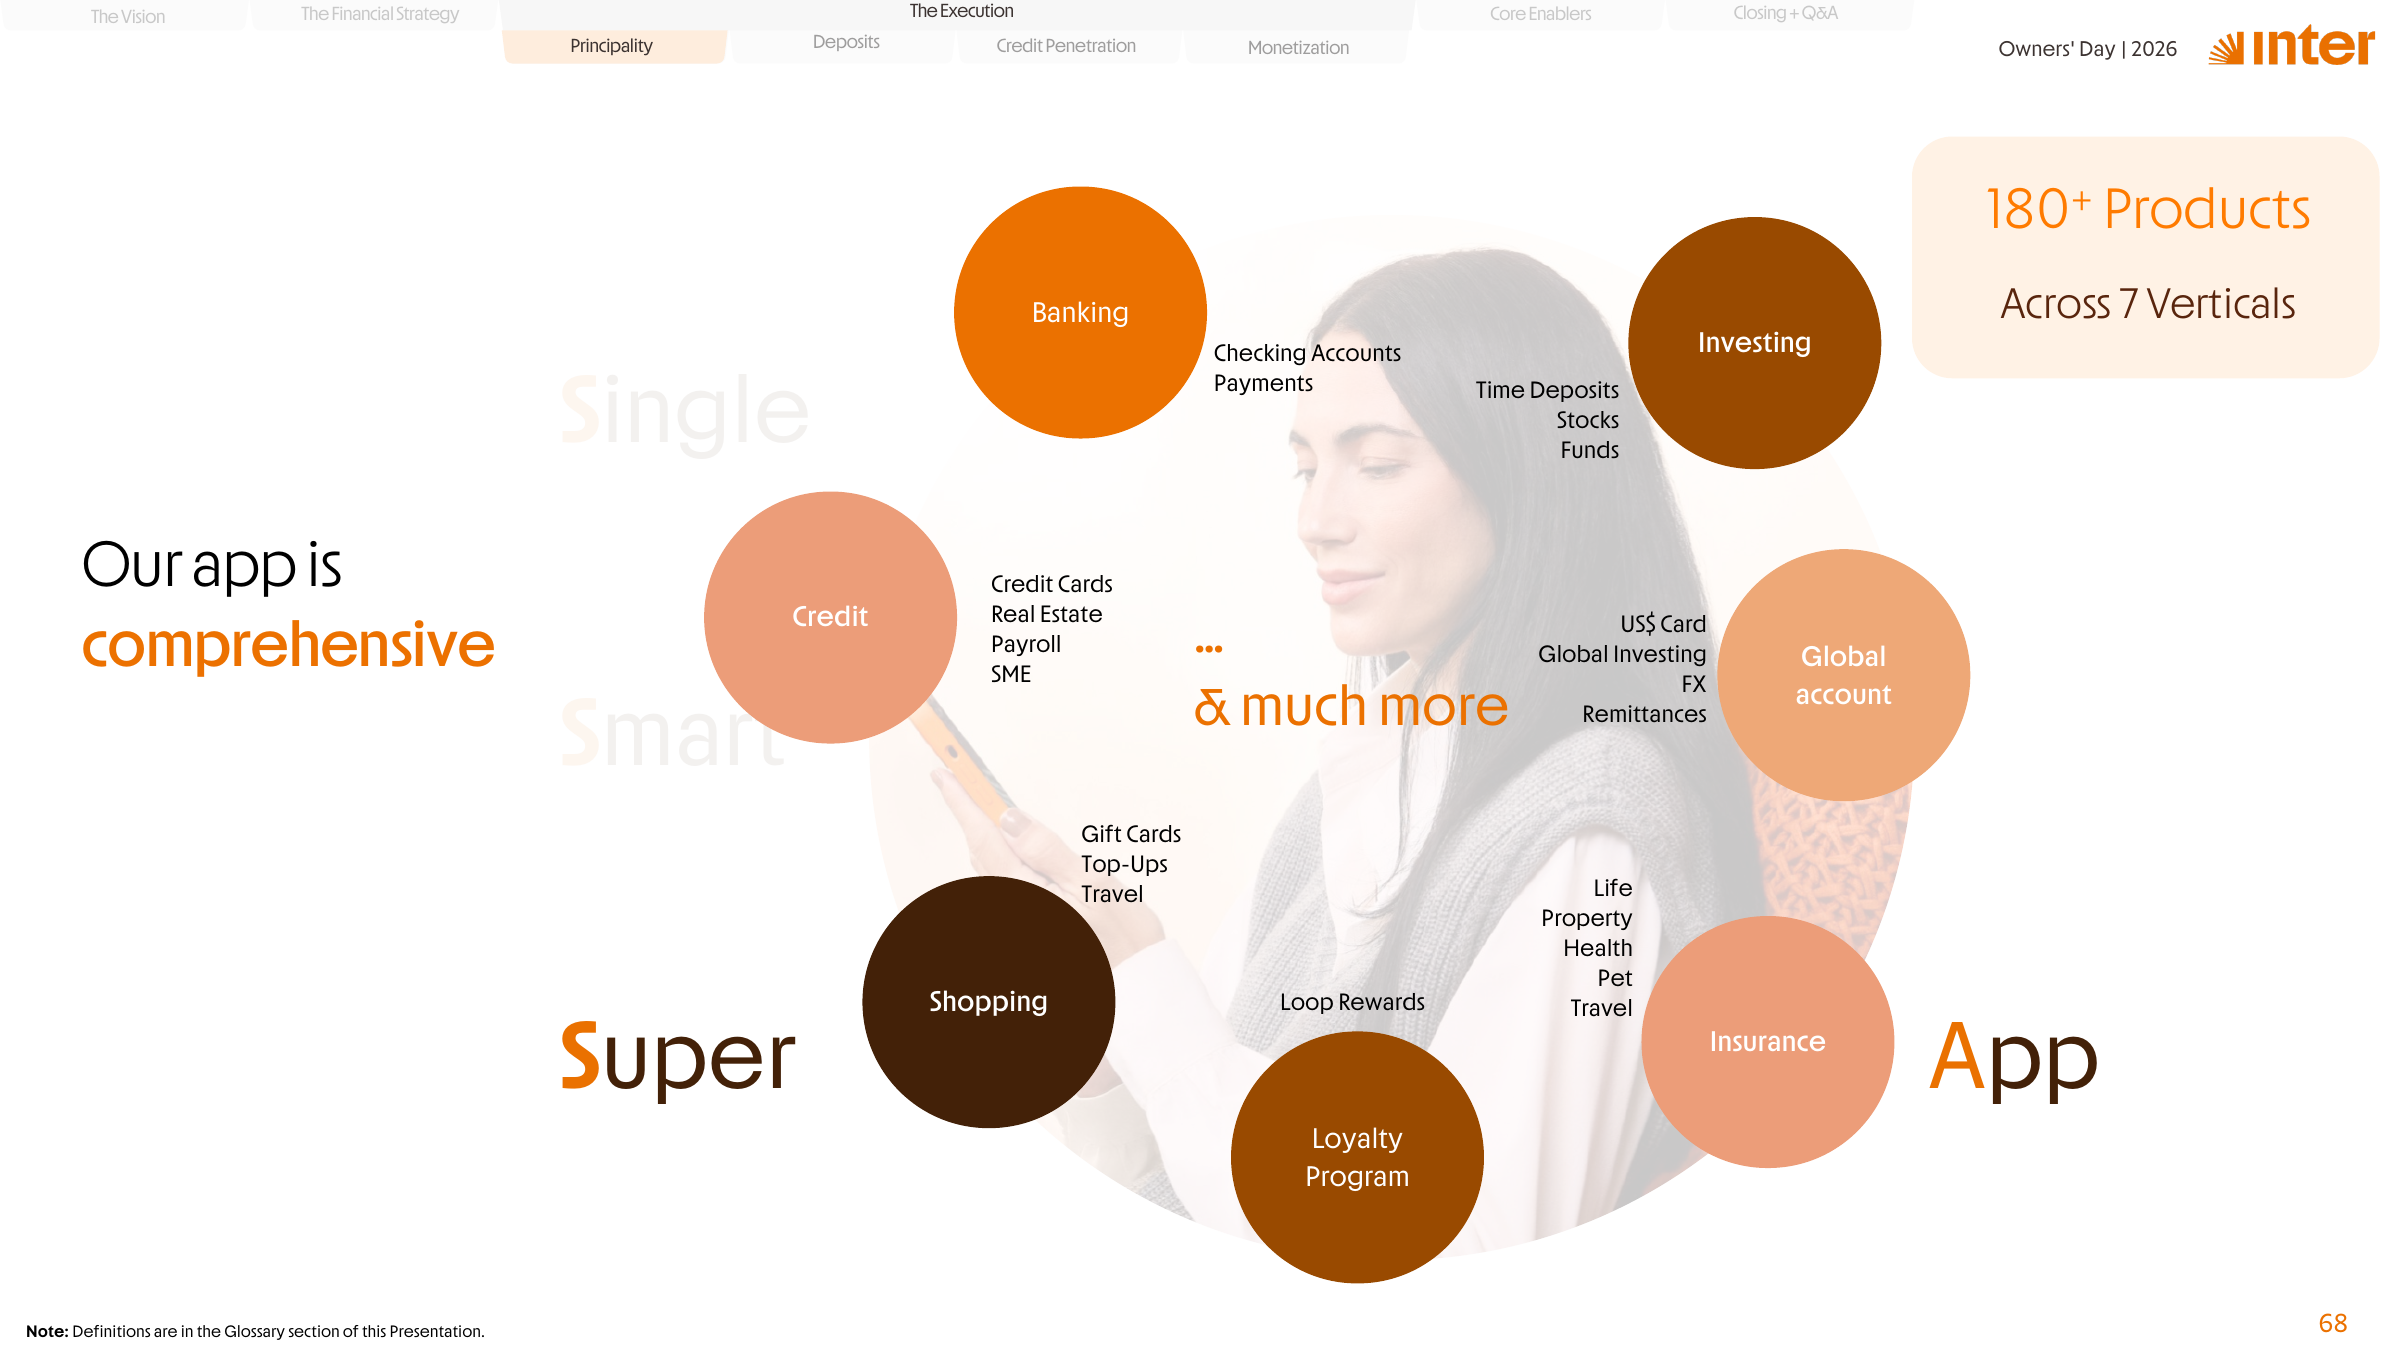
One Inter account distributes more than 180 products across seven verticals. In June the app handled 21.5 million daily logins, 32 million daily financial transactions, and roughly 9% of Brazil’s Pix instant-payment transactions. Inter’s flywheel is activity, deeper relationships, more funding, and sharper product offers. The app already owns attention before the balance sheet owns market share. That gap is the hidden optionality. 1 4
Inter had 45.3 million clients but only 26.4 million active, a 58.3% activation rate. At the same base, 65% activation would add about 3.0 million actives. That is our illustration, not guidance. With loans per active client up 11%, Inter can grow through activation, deeper product use, and outside share gains. Two begin with customers already acquired. 1 2
What changes when Inter becomes the main account?
In Inter’s company-defined 1Q26 data, primary-account clients used 7.4 products and generated R$119 in gross monthly revenue per active client, versus 4.5 products and R$57 for the group. Q2 mature cohorts exceeded R$100, compared with a group average of R$58.6. It is correlation, not causation, but deeper relationships are associated with far more revenue. 1 2 4
Does that revenue require an expensive service machine? So far, no. Q2 net monthly revenue per active client rose 10%, cost to serve stayed near R$13.2, and margin per active client increased 16% to R$22.2. These are company-calculated operating measures rather than formal accounting measures, but the message is strong: customer value is rising while service cost barely moves. 1 2
Can credit make the ecosystem harder to leave?
The stickiness comes from usefulness and duration, not trapping anyone. Mortgages can anchor a relationship for years; payroll lending sits inside monthly cash flow. In March, mortgage and home-equity clients used about 8.5 products, private-payroll clients 6.4, and the group 4.5. Selection explains some of the gap, but long-lived credit creates repeated chances to cross-sell. Once Inter becomes the financial home screen, replacing it becomes less attractive. 3 4
Average monthly revenueR$59
Mature-client revenue>R$100
Main-account revenueR$119
Analyst illustration: moving credit penetration from roughly 34% to 40% would add about 1.6 million clients. The value appears only if those loans are underwritten well.
Credit is the largest visible monetization lever, but not the only one. Investments, insurance, shopping, loyalty, foreign exchange, and U.S. services can deepen revenue without another loan. Management classified 59% of 1Q26 gross monthly revenue per active client as interest-based, so banking risk remains. The winning version adds both fee revenue and carefully underwritten credit. 2 4
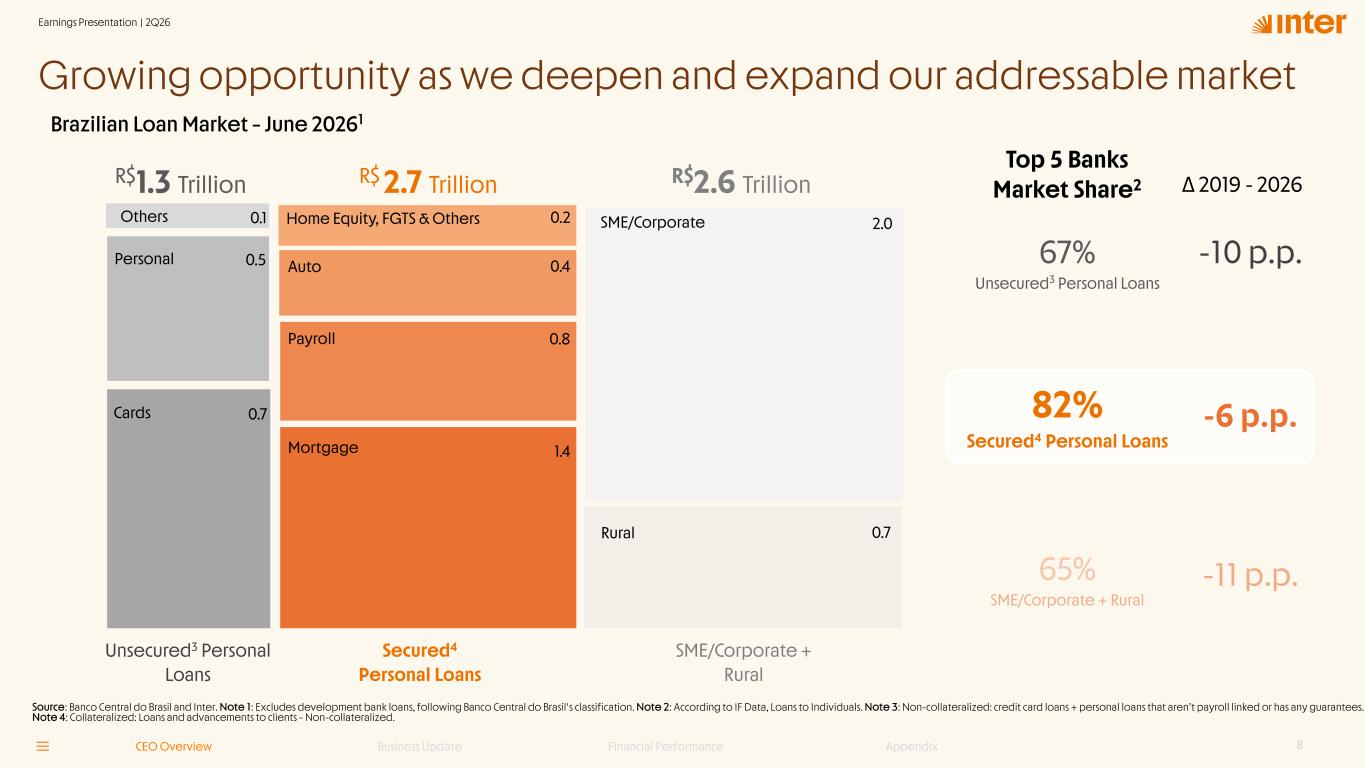
Here is the oddity: Inter touches about 9% of Brazilian Pix transactions, yet its R$51.9 billion gross loan book is only about 0.8% of the R$6.6 trillion credit pool mapped by management. These are different measures, not a market-share comparison. But the relationship gap is striking. Inter already has traffic and low-cost funding while its loan book remains small beside the mapped opportunity. Careful conversion could support years of growth. 1 2 3
Now the fun part
What is a 32% grower doing at ~7× Q2 run-rate earnings?
This is where cheap becomes explosive. Inter reported R$0.94 of Q2 profit per share after accounting for potential share dilution. Annualized and translated at the August 10 official Brazilian central-bank exchange rate of R$5.0960 per dollar, that is roughly US$0.738 a share. Against today’s $5.24 price, INTR screens near 7.1× earnings. This is mechanical, not a forecast: tax, credit losses, lending margins, share count, and currency may change. Q2 also had a disclosed timing benefit in lending margins. 3 5 8 9
How much must go right? Less than the 32% growth rate suggests. Inter does not need 30% return on equity or a Nu-like valuation. It needs durable earnings, controllable credit, and self-funded growth. Then compounding becomes the reward, not the entry assumption.
| Company | Scale | Revenue growth from a year ago | Price ÷ annual earnings pace |
|---|---|---|---|
| Inter | 45.3m clients | 31.7% · Q2 net revenue | ~7.1× |
| Nu | 135.2m customers | 42% · Q1, excluding currency swings | ~19.1× |
| SoFi | 15.8m members | 43% · Q2 reported revenue | ~39.0× |
Quick valuation snapshots, not price targets. The businesses, accounting, and reporting periods differ. Prices are live August 11 snapshots. Nu uses Q1 profit per share of $0.1776; SoFi uses unrounded Q2 income and share count. The point is how much more confidence investors currently place in Nu and SoFi. 1 3 8 9 10 11 15 16 17
Inter need not become Nu. It must show Q2 was not a peak and grow profit per share without a credit accident or issuing many new shares. If that proof arrives, even 10× to 12× earnings can do serious work.
Management and capital
Can retained earnings turn Inter into a self-funded compounder?
Inter defines its banking Rule of 50 as net revenue growth plus return on equity. Q2 was 31.7% plus 16.3%, or 48%. Call it 48, not 50. It is still exceptional: revenue is outgrowing costs while operating efficiency and returns improve. Inter is becoming more valuable with scale. 1 2
The 60/30/30 plan calls for 60 million clients, a roughly 30% cost-to-income ratio, and roughly 30% return on equity by year-end 2027. Q2 stood at 45.3 million, a 42.1% cost-to-income ratio, and 16.3% return on equity. A secondary Q2 transcript also quotes management discussing roughly 30% growth for several years. It is confidence, not formal guidance, but low product shares make it understandable. 1 4 5
What might the next real earn? Management’s internal estimates use a 22% potential return on new credit capital and report roughly 30% return on 1Q26 private-payroll loans. These are not audited next-dollar returns, and the loans are young. They do show the hurdle management says it is underwriting toward. 2 4
Reported accounts point the same way. H1 attributable profit rose about R$214 million year over year while average attributable equity increased roughly R$1.26 billion. Annualizing the profit gain produces an indicative 34% incremental-return screen. It is our calculation, not causal ROE; rates, mix, taxes, costs, and timing contribute. Still, recent growth looks capital-efficient. 3
Management says Banco Inter reached capital neutrality in Q2, meaning profit replenished the regulatory capital consumed by growth. Inter also presented R$2.3 billion held outside the regulated banking group as excess capital, paid R$259.6 million of dividends in March, and reported no share buybacks in H1. No formal allocation order is disclosed. Reinvest where realized returns stay high; return capital that cannot meet the hurdle. 1 2 3
What if management is even partly right through 2029?
Management illustrates net revenue growth plus return on equity near 50 through 2029. One author scenario is 20% growth plus 30% return on equity. Anything close, with sound credit, would be hard to value indefinitely at 7× earnings. Inter calls this a conceptual North Star, not guidance or a promise of 50% profit growth per share. 2 4
We believe Inter can deliver at least part of that ambition. From $0.738 of annualized Q2 profit per share, 20% annual growth in dollar profit per share gives about $1.28 by Q2 2029. At 10× earnings, that is $12.75; at 12×, $15.30, about 2.9 times today’s price. At 25% growth and 14×, the illustration reaches $20.18, about 3.9 times today’s price. Partial success can still create huge upside. 3 8 9
What about ten years? If dollar profit per share compounds 15% annually and INTR earns a 12× multiple in Q2 2036, the illustration reaches $35.83 before dividends, roughly 6.8 times today’s price. That is not a target and assumes far less than full Rule of 50. A decade can turn a small multiple and steady per-share growth into something extraordinary, or magnify credit and currency mistakes. 3 8 9
Formula: $0.738 × (1 + assumed yearly dollar profit-per-share growth)³ × assumed price-to-earnings multiple. These are conditional analyst scenarios, not targets. Rule of 50 does not determine profit per share. Credit costs, conversion from Brazilian reais into dollars, new-share issuance, and the 2029 multiple remain separate assumptions. 3 8 9
The facts that can break it
What would permanently weaken our view?
Credit deterioration is the clearest answer. Cards are generally unsecured, and personal loans mix payroll-backed and unsecured exposure. Yet protection is meaningful in parts of the book. Management classified 67% of the 1Q26 portfolio as secured. In Q2, real-estate loans were 35.1% of total loans. In 78.1% of that real-estate book, borrowers owed no more than 70% of the property value; in 99.3%, they owed no more than 90%. The largest borrower was only 0.38% of loans. 3 4
Company-defined funding was R$77.2 billion, and loan-loss reserves covered 134% of loans already more than 90 days overdue. Banco Inter’s overall regulatory capital ratio was 14.4%, with an 11.5% core equity buffer, the highest-quality layer of bank capital. These are cushions, not shields. Reserve coverage fell from 137% in Q1 and 143% a year earlier. The valuation absorbs expectations, not loan losses. 1 2 3
Loans more than 90 days overdue rose to 5.3% of the book, from 5.1% in Q1 and 4.6% a year ago. The annualized burden from credit provisions and recoveries reached 5.9% of average loans. Private payroll grew from R$0.7 billion to R$2.8 billion in twelve months and caused 0.53 percentage points of the 0.65-point yearly rise in overdue loans, according to management. It blames much of the pressure on relinking deductions after job changes. Results must prove the fix. 1 2
A credit-card write-off timing change also moved the share of loans more than 90 days overdue by about 0.30 percentage points, with no effect on provisions or credit-loss cost. Watch the full credit picture, not one ratio. 1 2
What breaks the thesis? Repeated evidence that deeper credit penetration requires weaker underwriting. Rising payroll delinquencies after remediation, credit-loss cost materially above Q2’s 5.9%, falling reserve coverage, shrinking profit after credit costs, or a return to raising outside equity would show the ecosystem scaling risk instead of customer value. 1 2 3
Why stay bullish? Secured real-estate and payroll-linked exposures can reduce loss severity, funding and capital buy time, and 7.1× leaves room for imperfection. If credit stabilizes while growth continues, today’s fear can fuel tomorrow’s rerating.
Fiscal pressure earns part of the discount.
Gross government debt reached 81.9% of GDP in June and the trailing nominal deficit was 9.99%. Fiscal slippage can keep rates high and weaken the real. 7 Yet the IMF called Brazil remarkably resilient and its banks well capitalized and liquid. 14 Inter grew revenue and earnings above 30% with Selic over 14%. 1 2 6 We need no perfect Brazil, only disciplined share gains.
Our answer
This could be a legendary opportunity, but the numbers must keep earning that word
At $5.24, the wager is simple: earnings are more durable than the valuation implies. Inter needs controlled credit, self-funded growth, and local earnings that outrun depreciation in the Brazilian real. It does not need 30% growth forever, a risk-free Brazil, or Nu’s multiple.
What if it works? Investors get fintech growth, improving bank economics, sticky credit relationships, rising capital efficiency, and years of share-taking runway, all against a deeply skeptical valuation. That is a rare combination. 1 2 4 9
INTR is not safe, which is partly why the opportunity exists. We believe Inter may be crossing from promising fintech to self-funded compounder while priced like a fragile lender. If credit holds and ROE climbs, the market need not fall in love. It only needs to stop treating current earnings as temporary. From 7.1× annualized Q2 earnings, partial success can be powerful and exceptional execution extraordinary.
Sources and limits
Source register
Financial data are through June 30, 2026; live prices are timestamped August 11 and the official Brazilian central-bank exchange rate is through August 10. Sources are official issuer, SEC, Brazilian central bank, IMF, and Nasdaq materials except where a secondary transcript is explicitly identified. Annualized price-to-earnings multiples and return scenarios are analyst-derived screens, not guidance or formal price targets.
- Inter & Co 2Q26 earnings release. Results, KPIs, portfolio commentary, and management discussion; August 5, 2026.
- Inter & Co 2Q26 earnings presentation. Growth, market share, Rule of 50 framing, Brazilian market sizing, and asset quality.
- Inter & Co 2Q26 interim IFRS statements. Profit per share, share count, loan composition, collateral, capital, and provisions.
- Inter & Co 2026 Owners’ Day presentation. Super-app architecture, cross-sell economics, secured credit opportunity, and management’s long-term North Star.
- Inter 2Q26 earnings call transcript. Secondary transcript used for management outlook wording; August 5, 2026.
- Banco Central do Brasil: Selic history. Official policy rate history showing that the entire second quarter remained above 14%.
- Banco Central do Brasil: June fiscal statistics. Gross debt, primary balance, interest expense, and nominal deficit; published July 31, 2026.
- Banco Central do Brasil PTAX. August 10, 2026 Brazilian reais per U.S. dollar bid and offer; their R$5.0960 midpoint is used for the earnings translation.
- Nasdaq live INTR quote. $5.2377 at 11:28 a.m. ET on August 11, 2026; rounded to $5.24 in the report.
- SoFi 2Q26 earnings release. Official operating and financial results used for the secondary peer comparison.
- Nu Holdings 1Q26 filing. Q1 customer count and management revenue growth excluding currency moves, used in the peer table.
- Banco Central do Brasil: 280th Copom minutes. Official August 5, 2026 decision reducing Selic to 14.00%, effective August 6; minutes published August 11.
- Banco Central do Brasil: June credit statistics. Brazilian financial system credit growth and lending conditions; published July 30, 2026.
- IMF 2026 Article IV consultation for Brazil. Macroeconomic resilience, banking system assessment, and fiscal risk discussion; July 23, 2026.
- Nasdaq live NU quote. $13.56 at 11:29 a.m. ET on August 11, 2026.
- Nasdaq live SOFI quote. $18.0801 at 11:29 a.m. ET on August 11, 2026; rounded to $18.08 in the peer screen.
- Nu Holdings 1Q26 interim IFRS statements. Profit per share and weighted average shares used in the annualized peer valuation screen.
Research disclosure
This is general research and editorial opinion, not personalized investment advice or an offer to buy or sell a security. Investing can result in loss of principal. Position disclosure: the author’s current INTR position was not provided for this publication. Readers should assume the author may own INTR or related securities and could benefit if the price rises.